Logarithmic scales are a type of scale often used by scientists and engineers to make large numbers more manageable. But what are they? And how can small businesses make use of them? Keep reading to find out the answers to these questions and more.
How Logarithmic Scales Work

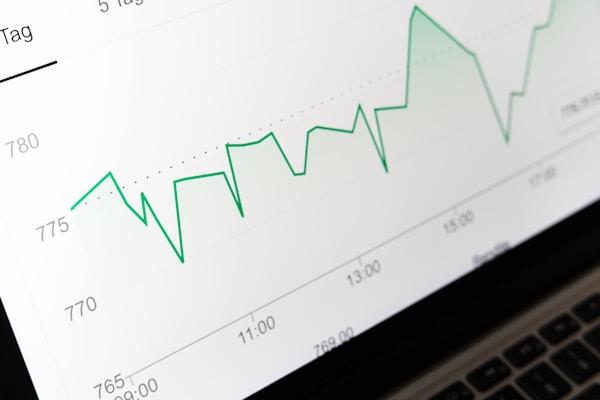
Before learning about how to best use these scales, this page will first answer the question, “What is a logarithmic scale?” A logarithmic chart is a graph that shows data on a scale of powers of ten. This type of chart is often used to show scientific data or data that is otherwise difficult to understand when graphed on a linear scale. The logarithmic scale compresses large differences in data so that they can be more easily seen and compared. These charts are non-linear and helps to display numerical data over a large range of values.
Using a Logarithmic Scale in Practice
Logarithmic scales are a way of representing data that is spread out over a large range with a more compressed scale. This can be helpful when trying to compare or analyze data that is in different ranges. There are a few practical applications for logarithmic scales in small businesses. One example of how to use a logarithmic scale is when comparing the size of two different populations. In this case, you might have one population that is 10 million people and another population that is 100 million people. If you were to represent these populations on a linear scale, the 10 million population would be represented as 1/10th of the size of the 100 million population. However, if you use a logarithmic scale, both populations would be represented as the same size. This can be helpful when trying to make comparisons between two populations that are vastly different in size. Another practical application for logarithmic scales is when trying to compare values over time. For example, if you are tracking sales over the course of a year, your data might range from $0 to $1,000,000. If you were to represent this data on a linear scale, your largest value would be represented as 100 times larger than your smallest value. However, if you use a logarithmic scale, your largest value would only be represented as 10 times larger than your smallest value. This can be helpful when trying to track changes in values over time because it gives you more detail about smaller changes in values.
Identifying and Interpreting Trends on a Log Scale

A logarithmic scale is also an effective way to identify and interpret trends when the data set is small. In a logarithmic scale, each unit of increase corresponds to a larger percentage increase. This makes it easy to see changes in the trend line even when there are only a few data points. For example, if you were graphing monthly sales over a one-year period and you had only six months of data, using a linear scale would make it difficult to spot any trends. However, if you used a logarithmic scale, you would be able to see that sales increased from January to February and then decreased again until April before increasing steadily until December. A logarithmic scale can also help you identify patterns in data that may not be immediately obvious when looking at the raw numbers.
Tips for Using Log Scales in Business Analysis
Compress the data so that it is easy to see the trends. Use a logarithmic scale when there are many data points or when you want to compare different data sets. And match the scale of the graph to the question you are trying to answer. A logarithmic scale will not always be appropriate, so use your best judgement. Make sure you understand how the logarithmic scale works before using it. It can be confusing at first, but with a little practice, you will be able to use it like a pro!
Whether you’re looking for business ideas for small towns or trying to understand the best ways to use a logarithmic scale, there are plenty of ways you can utilize the information in this guide to figure out your next steps.
Logarithmic scales are important for small businesses because they provide a more accurate representation of data when the data set is small. This is important because it allows businesses to make more informed decisions based on accurate information. Overall, logarithmic scales are an important tool for small businesses to use in order to make accurate decisions.
